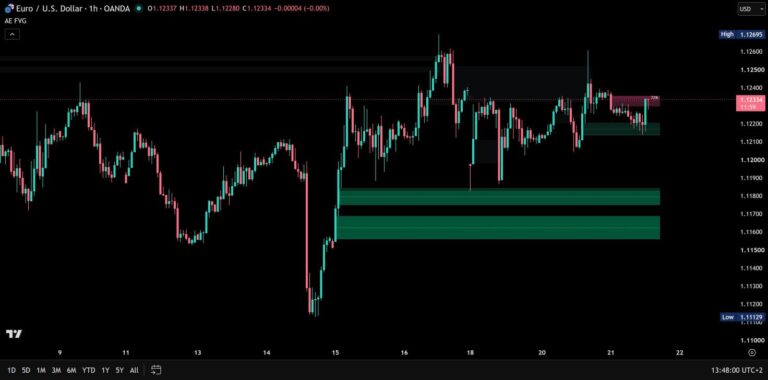
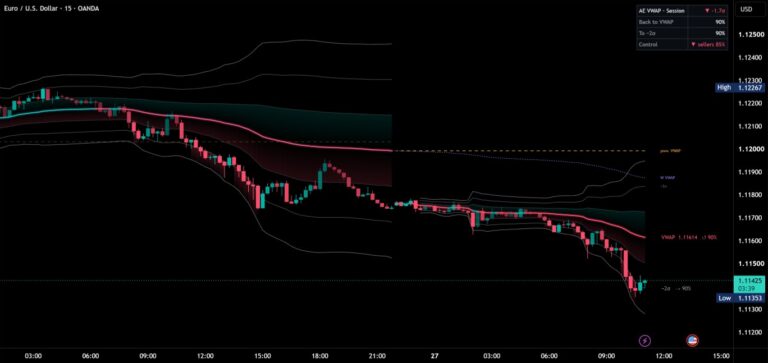
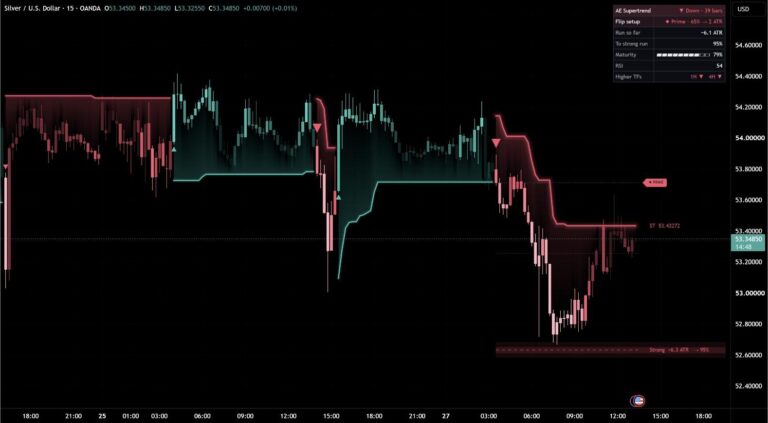
PremiumInvite-only
AE Market Structure
BOS and CHoCH with a quality score and a hold chance for every break – measured on your own chart.
- 30 days free
- No payment details
- Nothing to cancel
Tested
Tested on 30 market and timeframe combinations
Forex, metals, oil, indices, crypto and US stocks on 15 minutes, 1 hour and 4 hours, all with default settings. For the quality score, 10 combinations were used for development and 20 others only to confirm the results.
- combinations where the hold chance predicted the outcome of breaks better than the hold rate of their tier
- 30 of 30
- average hold chance given and the share of breaks that actually held
- 56.0 → 56.3%
- of the breaks ahead of the typical path after 5 candles were beyond its median after 20 (behind it: ≈22%)
- ≈77%
- how much more often strong breaks held than weak ones, with pivot lengths from 3 to 75
- +23–27 pts
- half of the strong breaks moved at least this far within 20 candles (weak: 0.8 ATR)
- 1.6 ATR
- combinations where strong breaks ran further than weak ones
- 30 of 30
Rounded values from the author’s tests. On your own chart, the dashboard measures the same rates live. Past results are no guarantee of future results.
Before / after
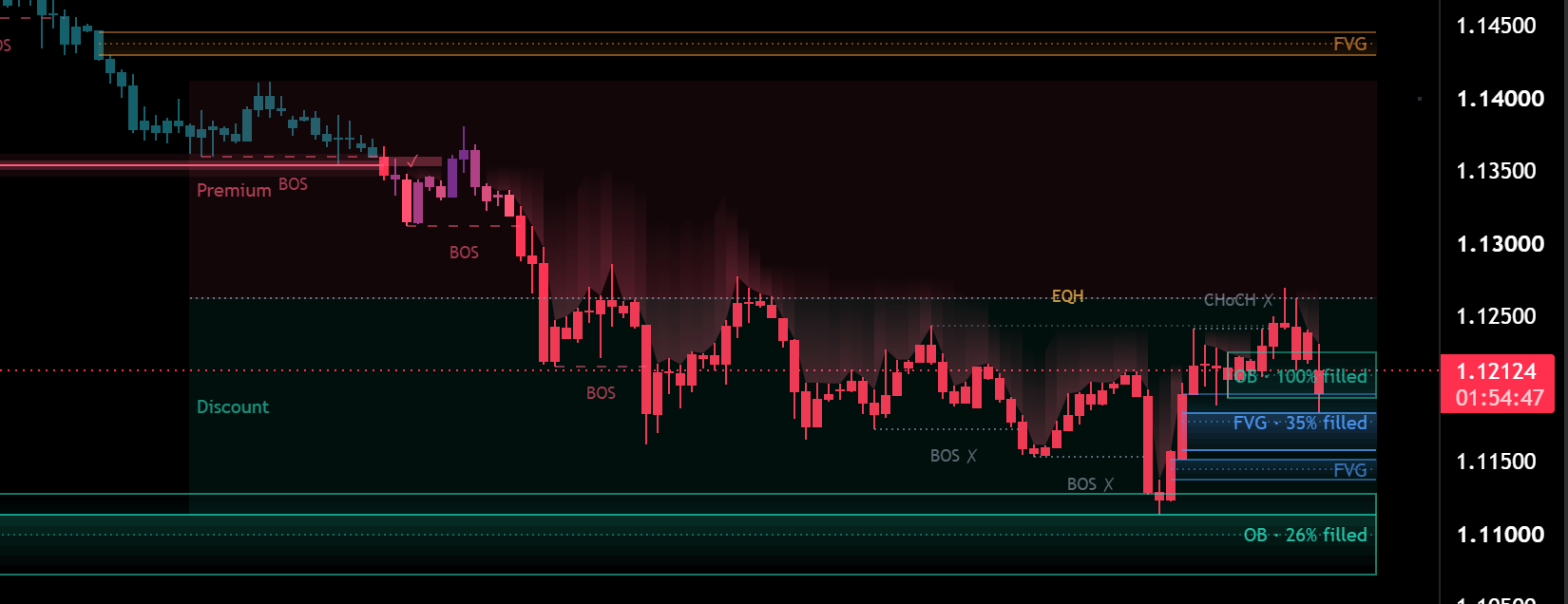
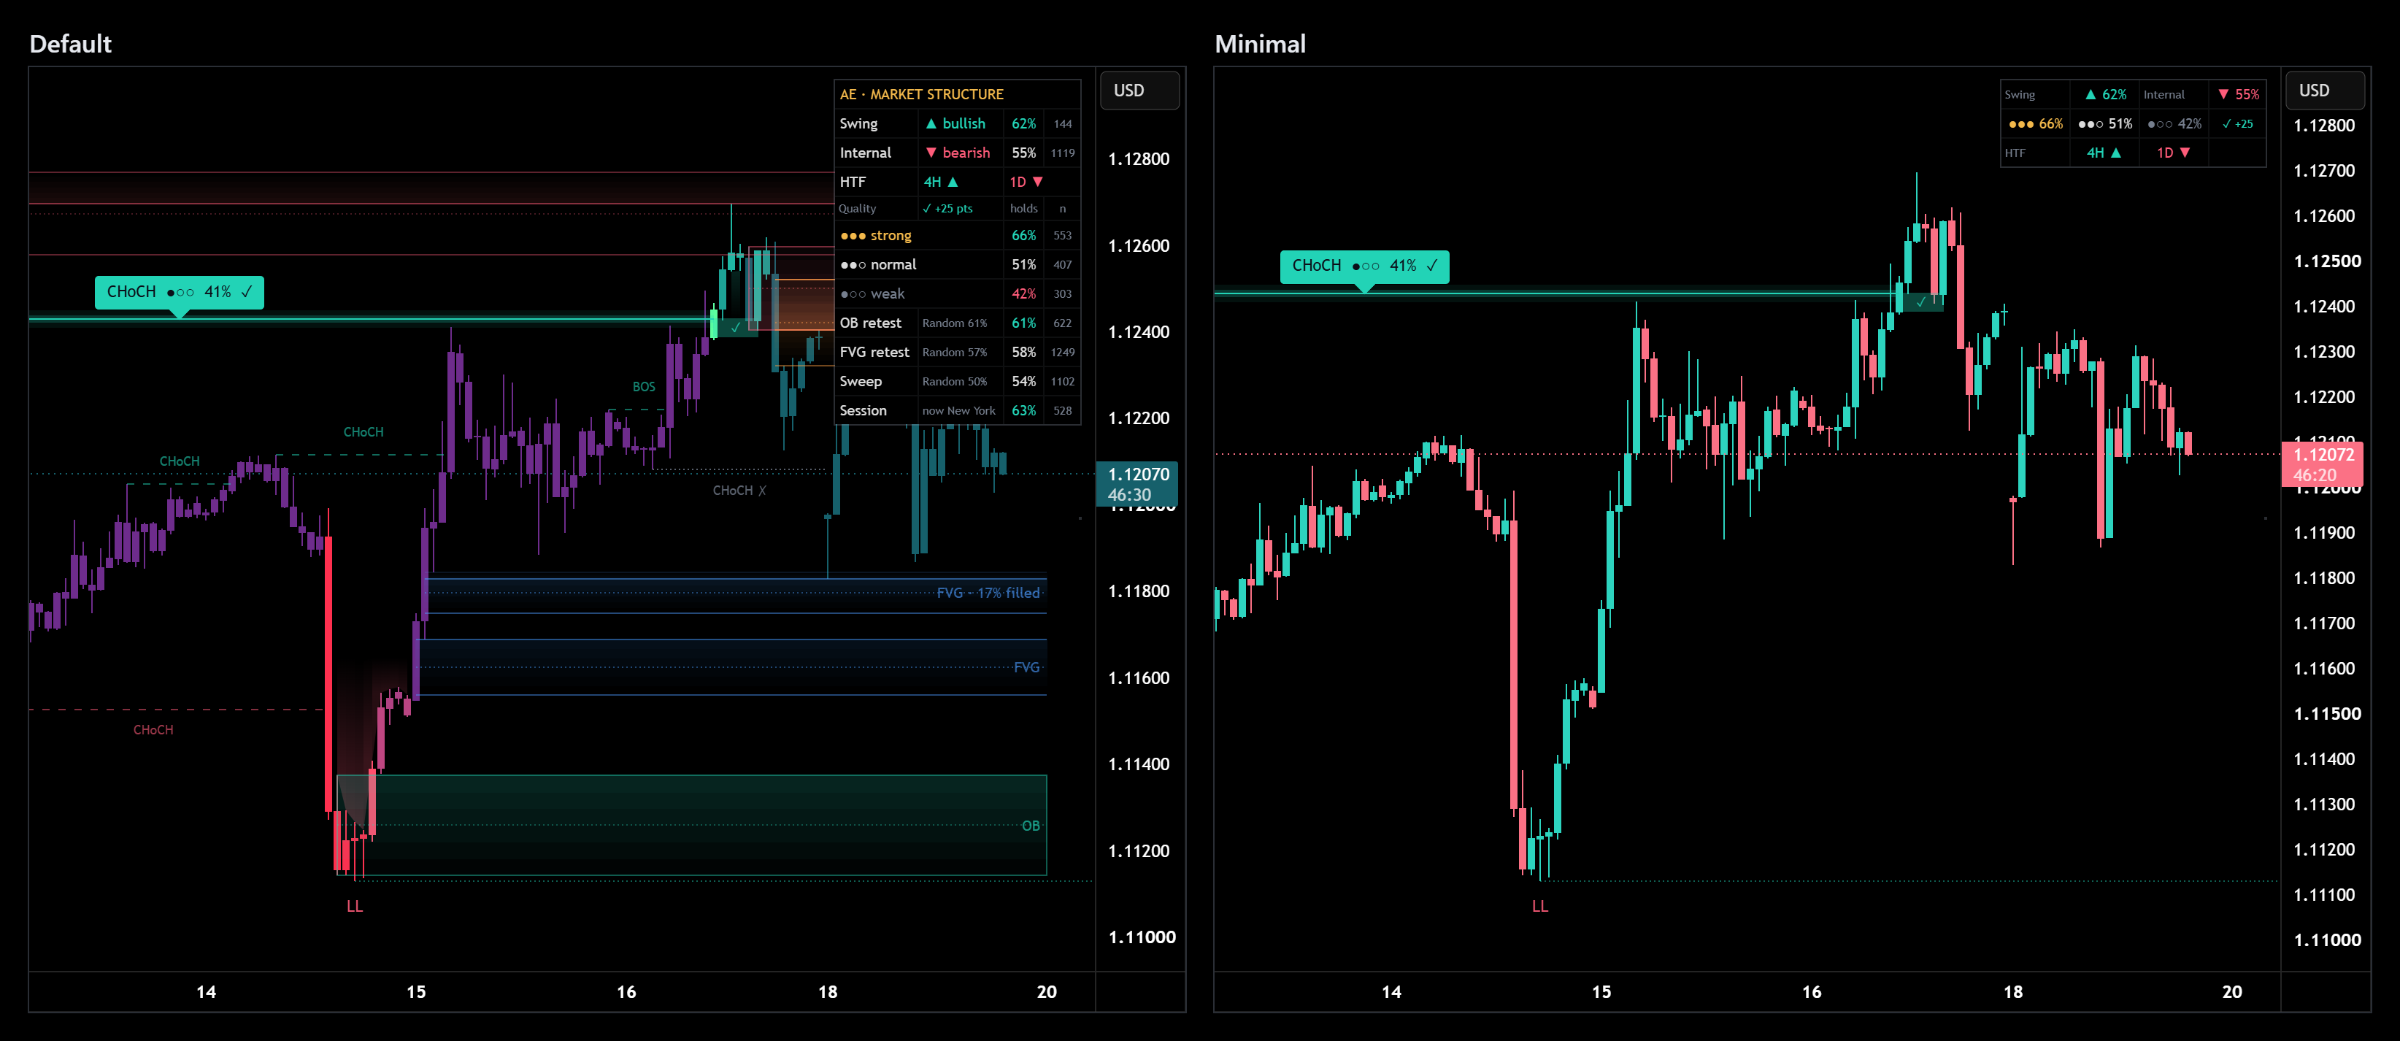
Same chart. Now with AE Structure.
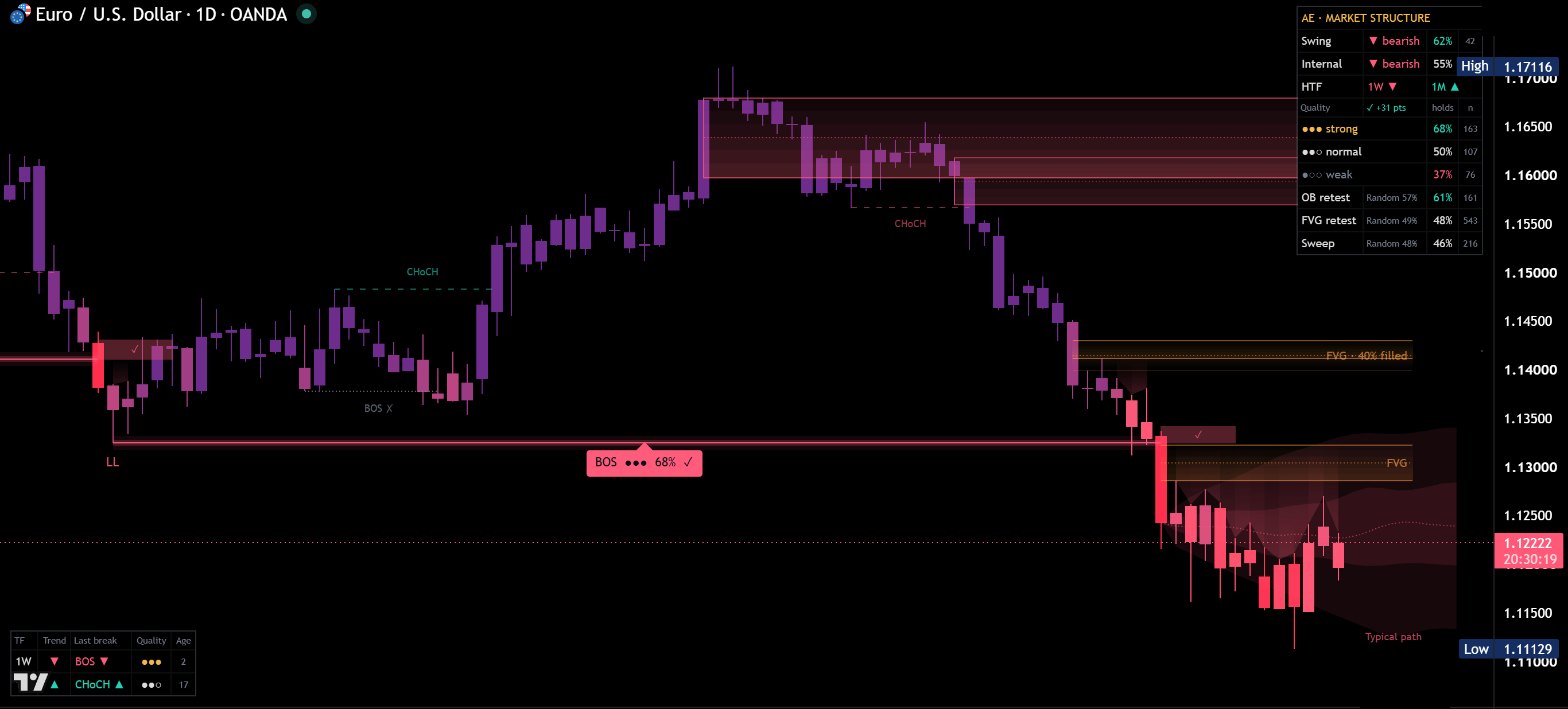
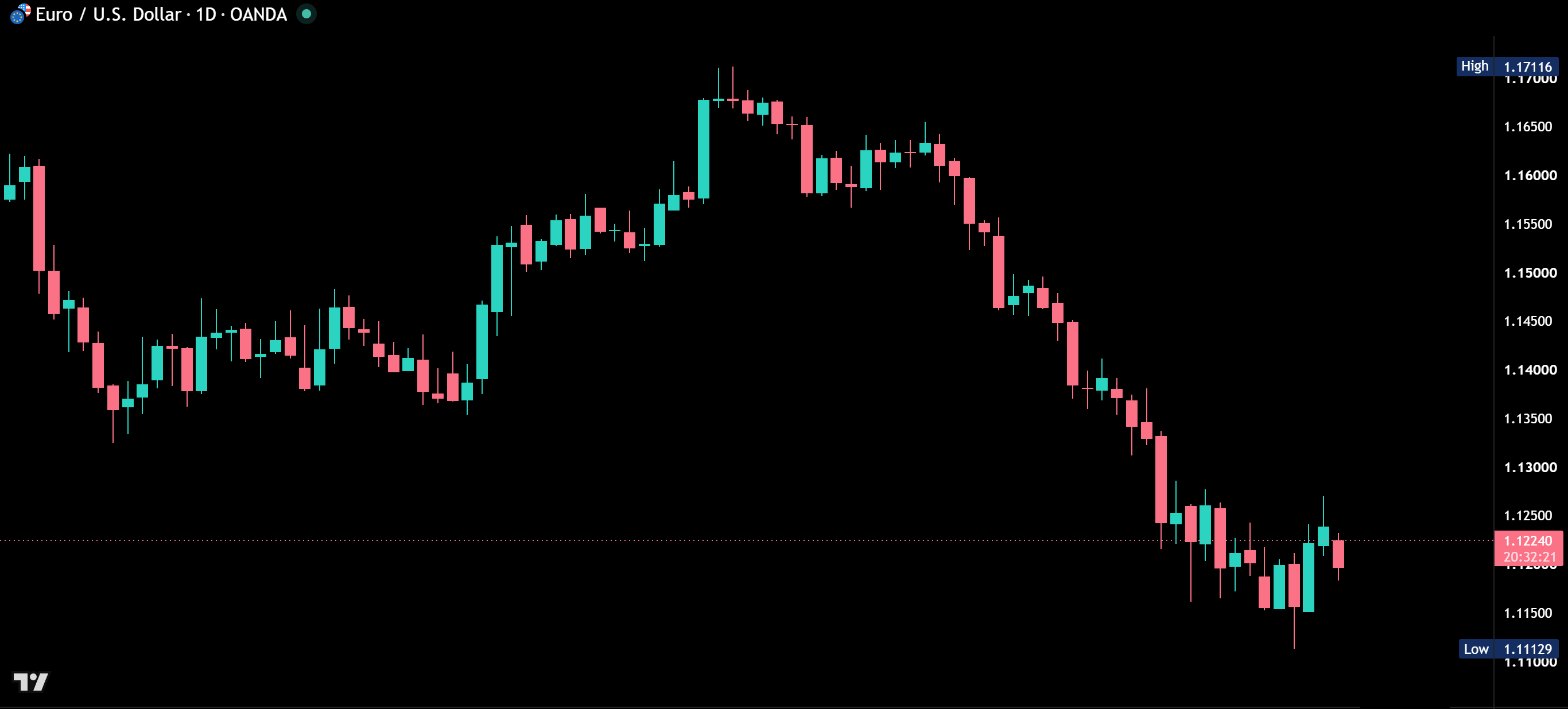
AE Market Structure maps internal and swing structure, grades every break of structure by quality and follows each break until it has held or failed. From the history of your own chart, every break also gets a hold chance right in the label – and the dashboard checks whether those chances come true on the market and timeframe you are looking at.
Every break graded by quality
Each BOS and CHoCH gets up to 6 points from five factors, selected because breaks that met them held more often in testing. Distances are measured in ATR (Average True Range, 14), so they adapt to volatility – one ATR is an average candle.
- Close beyond the level by at least 0.3 ATR – 2 points
- Body at least 50% of the candle – 1 point
- Candle range at least 1.2 ATR – 1 point
- Volume at least 1.5 times its 20-candle average – 1 point
- Session range: close beyond the core range of the previous day (previous week from 4 hours up) – 1 point
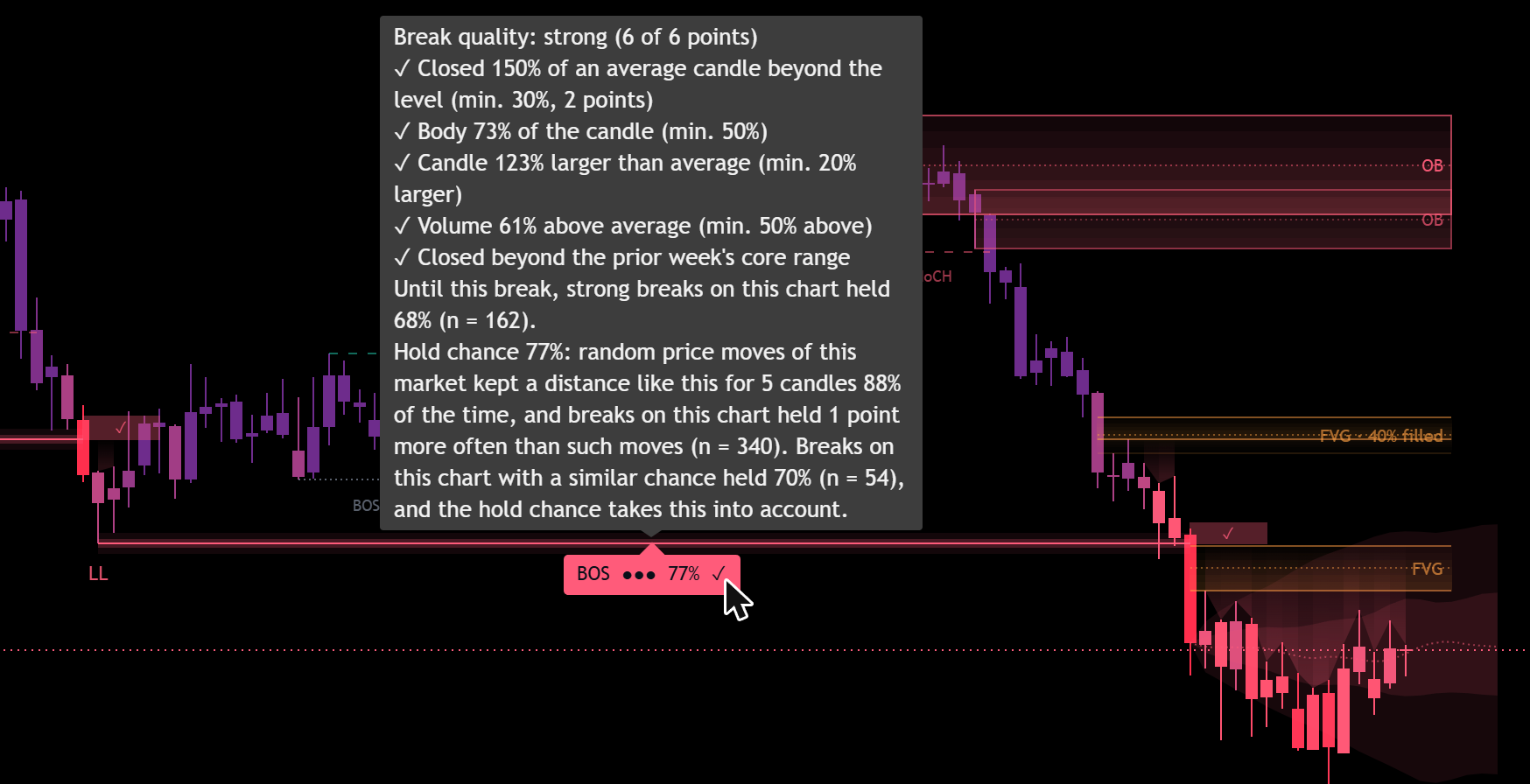
5–6 points is strong ●●●, 3–4 normal ●●○, 0–2 weak ●○○. Swing breaks carry the dots and their hold chance right in the label. Hover over a break and the tooltip explains its score and its hold chance in plain words.
Followed until it holds or fails
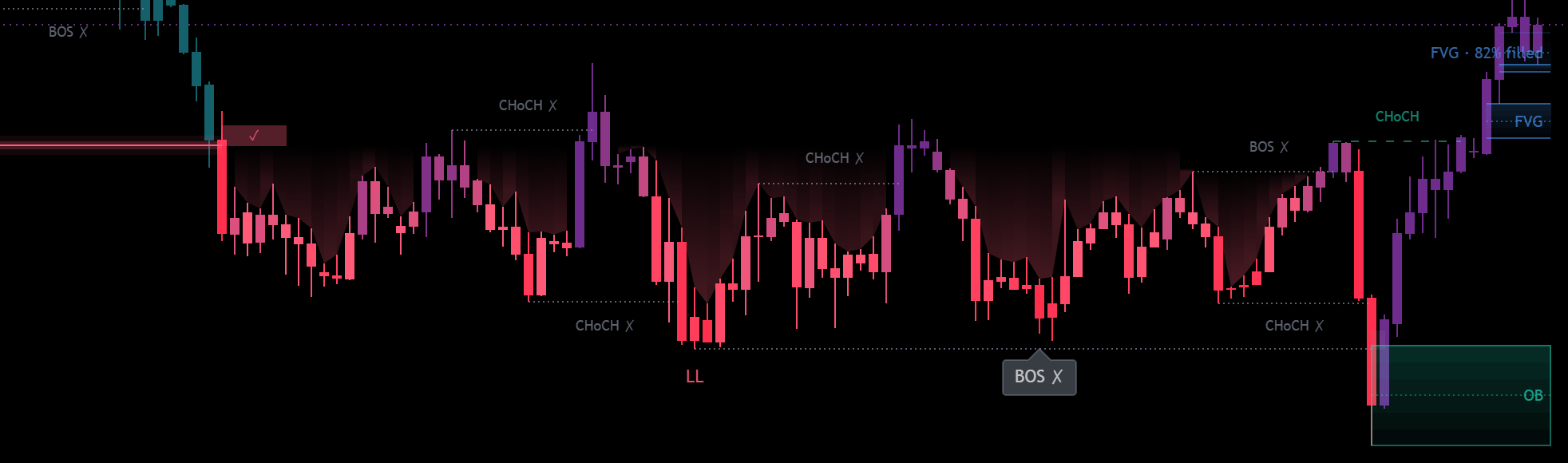
After a swing break, a retest zone shows how far price may pull back. It fills up candle by candle and shows ✓ once the break has held. If a candle closes more than 0.3 ATR back across the level within the next 5 candles, the break is marked ✗ and greyed out – the moment it happens. Both values can be adjusted.
Every outcome feeds the hold rates and the hold chance, updated on every closed candle. So the rates always describe the chart you are looking at.
A hold chance for every break
Every break also gets a hold chance in percent. It starts from this market’s own price moves: in how many of the last 500 stretches of 5 candles did price not close back further than this break can afford before it counts as failed? A break that closes further beyond the level can afford a larger move back. The hold chance then takes into account how breaks on this chart have actually done compared with such random moves, and how breaks with a similar chance have held here. Only completed candles and resolved breaks are used, and the chance is fixed the moment the break happens.
It appears once 20 breaks on the chart have been resolved. The tooltip explains it in plain words, and break alerts include it.
Next to Quality, the dashboard checks it on your chart: “✓ 56→57%” means the breaks there were given an average hold chance of 56% when they happened, and 57% of them held. ✓ means both agree within the statistical noise.
Results of the author’s tests
Tested with default settings on 30 market and timeframe combinations – forex, metals, oil, indices, crypto and US stocks on 15 minutes, 1 hour and 4 hours. For the quality score, 10 combinations were used for development and 20 others only to confirm the results.
- Hold rate by quality: strong breaks held about 70% of the time, normal ones about 53%, weak ones about 44%.
- Stable across settings: with pivot lengths from 3 to 75, strong breaks held 23 to 27 percentage points more often than weak ones – the defaults are not tuned per chart.
- Follow-through: within 20 candles, half of the strong breaks moved at least 1.6 ATR in the break direction, normal ones 1.1 ATR, weak ones 0.8 ATR. Strong breaks ran further than weak ones on all 30 combinations.
- Session range: breaks that closed outside the core range of the previous session held about 4 percentage points more often than breaks of the same quality inside it.
- Hold chance: on all 30 combinations, it predicted the outcome of breaks better than the hold rate of their quality tier (16,404 breaks compared).
- Calibrated: on average, breaks were given a hold chance of 56.0%, and 56.3% of them held – on 29 of 30 combinations, the two were within 3 percentage points.
- London session: breaks in the London session held about 4 percentage points less often than breaks with the same distance beyond the level in the other sessions – less often on 26 of 30 combinations. The tooltip points this out.
On your own chart, the dashboard runs this check live next to Quality – so you see whether the hold chances fit the market you are looking at.
Typical path
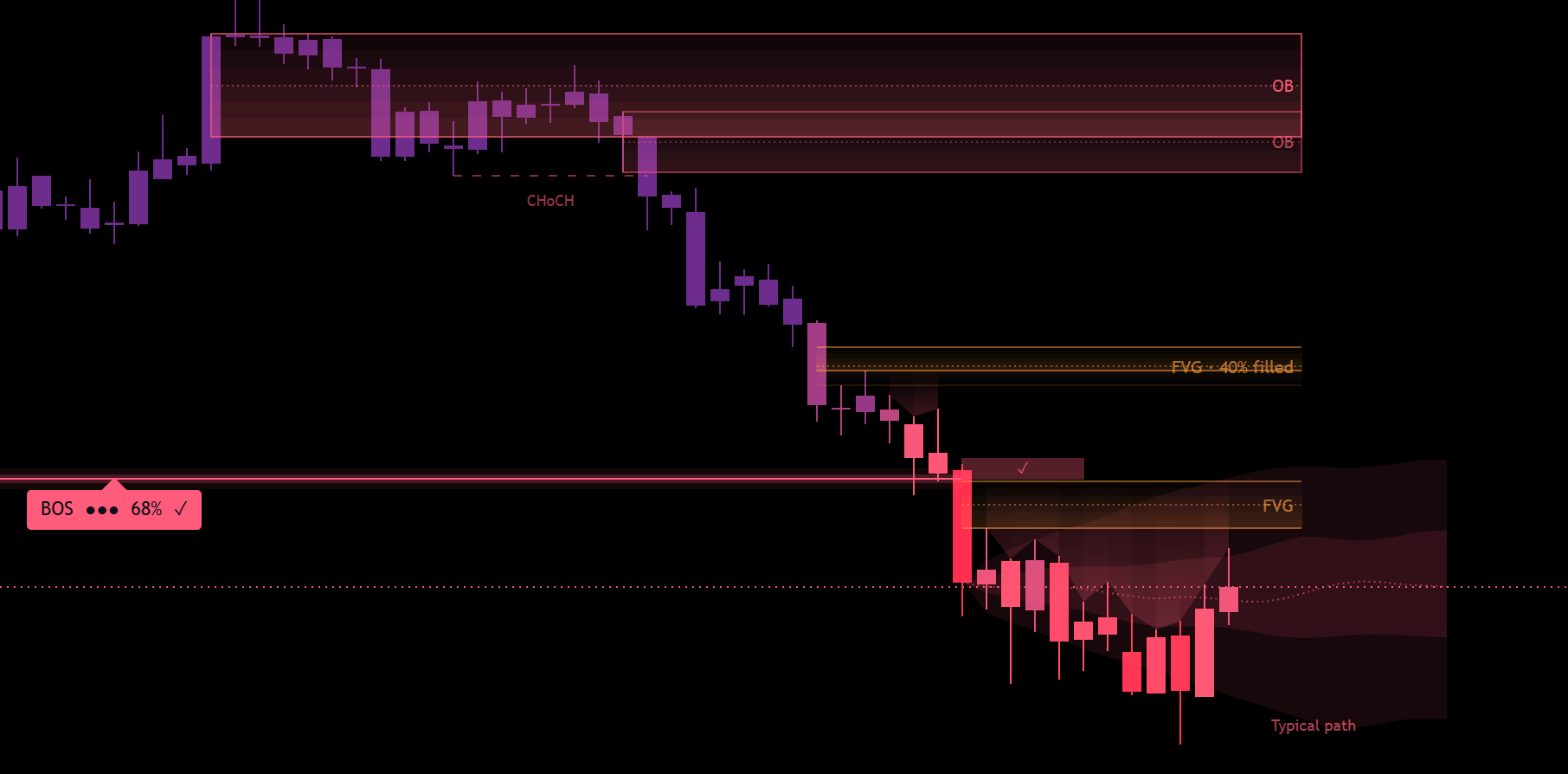
For 20 candles after the latest swing break, a soft cloud reaches from the breakout candle into the future. It shows where earlier breaks of the same quality closed in the candles after their break: the middle half of them inside the cloud, the dotted line is the median. The cloud is set at the break and does not change.
In the tests, about half of later swing breaks closed inside the cloud after 3, 5, 10 and 20 candles – just as a band of the middle half should. And the position after 5 candles told a lot: breaks ahead of the cloud were beyond the median after 20 candles in about 77% of cases, breaks behind it in about 22%.
Order blocks, fair value gaps and sweeps
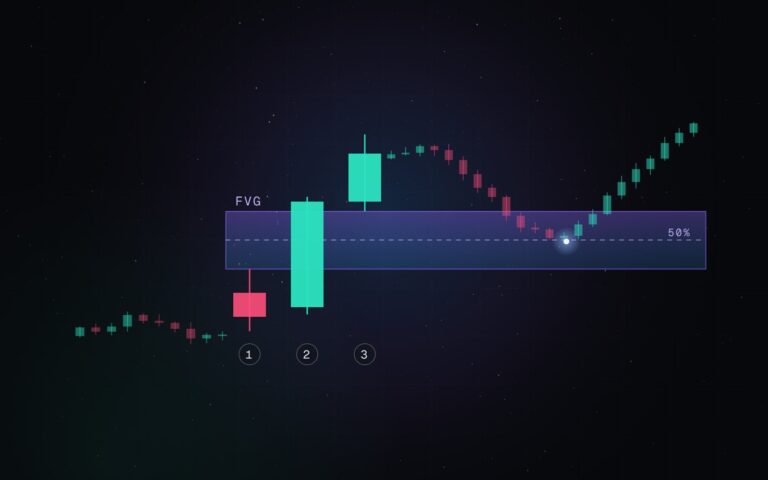
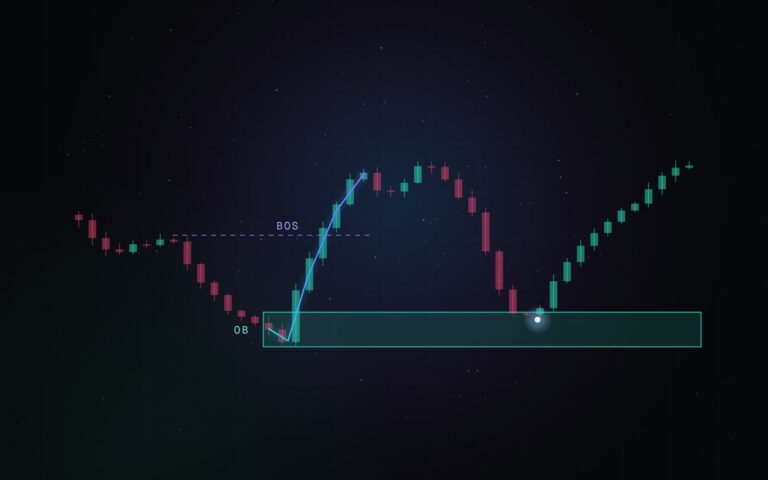
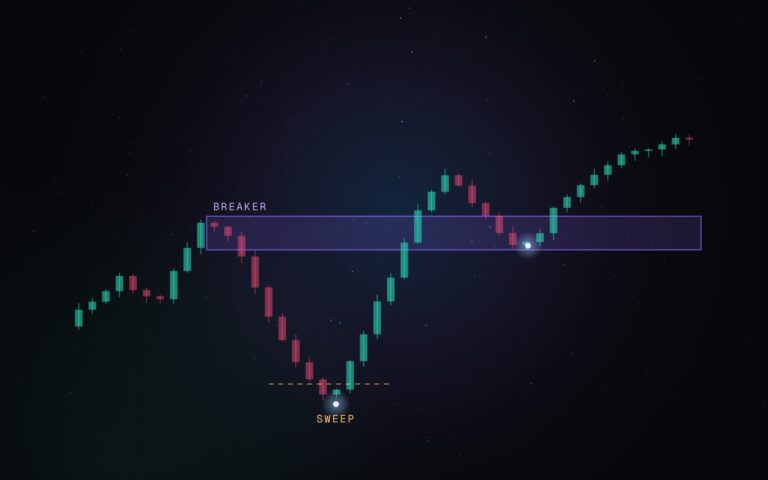
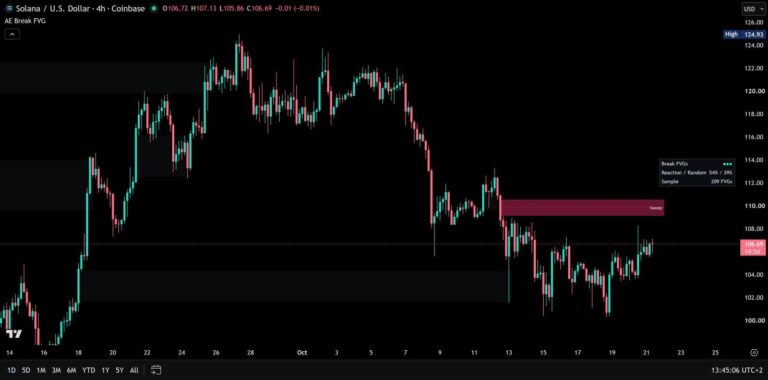
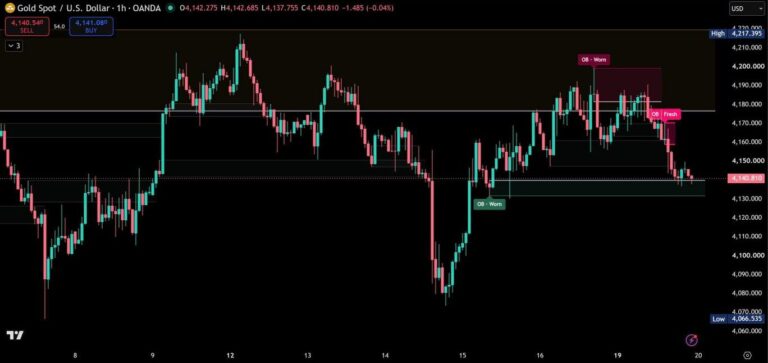
Order blocks are drawn as boxes with a 50% line, fair value gaps as channels in their own colours with a live fill level (“40% filled”). Up to two per side closest to price stay on the chart, and blocks from swing breaks and gaps from 1 ATR are drawn stronger. Equal highs and lows (EQH / EQL) are marked, and a Sweep label appears where a wick takes them and the candle closes back inside.
For each of them, the dashboard shows how often they held on your chart next to a “Random” baseline – zones or candles chosen at random but measured with exactly the same rules. So you see at a glance whether they do better than chance on this market.
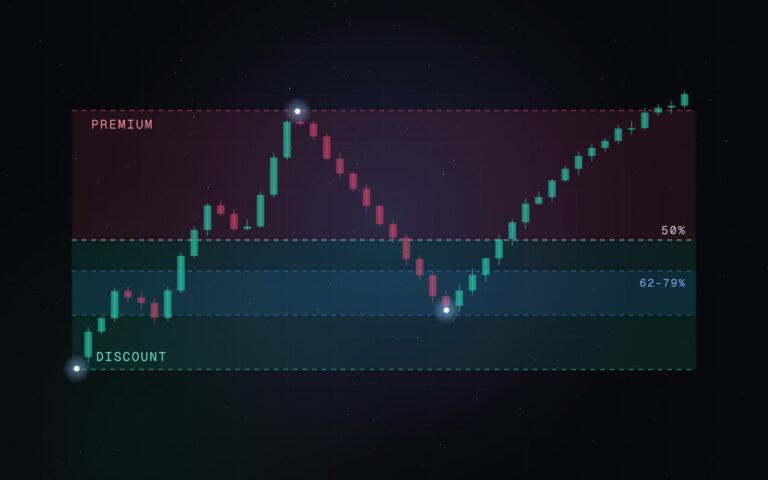
By default, the chart shows bullish order blocks in discount and bearish ones in premium, measured against the range of the last 100 candles. Switch on Premium / discount to see that range on the chart: premium above its middle, discount below. Under Range you can switch to 4H structure: the dealing range of the 4-hour chart between its confirmed swing high and swing low, which extends only after a new 4H pivot beyond a break. The shading, the filter and the alert then follow that range.
In a second test on 30 further market and timeframe combinations, price reversed more often after sweeps of internal highs and lows than after random wick candles with the same stop distance – on 15 minutes about 3.5 percentage points more often, on all 10 combinations of that timeframe.
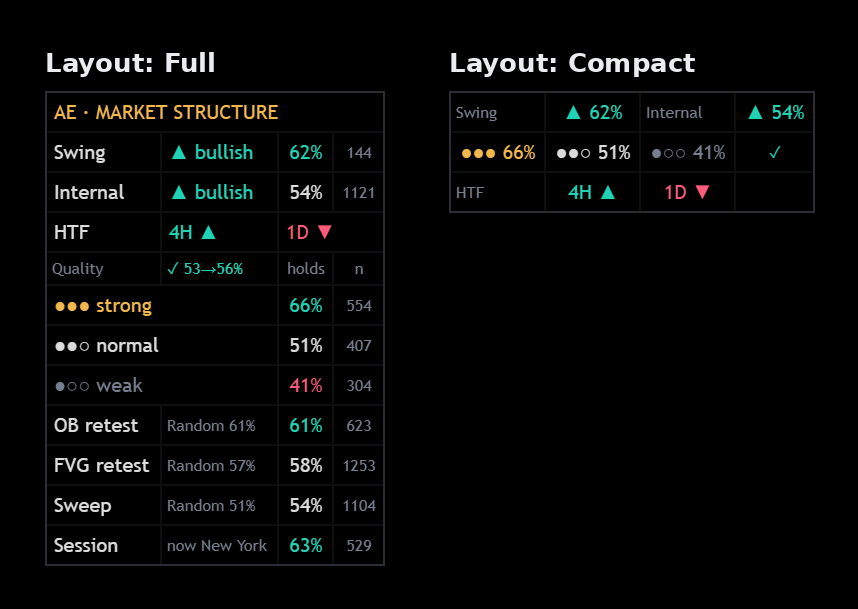
Dashboard and timeframe matrix
The dashboard shows the swing and internal trend with their hold rates, the trend of two higher timeframes, the hold rate of each quality tier, the self-check of the hold chance, the order block, fair value gap and sweep rates next to their baselines and – below the daily chart – the hold rate of breaks in the session that is running now. It comes in three sizes, and the Compact layout fits it into three short rows for phones: trend with hold rates, the quality tiers with the self-check and the higher timeframes.
The timeframe matrix lists trend, last break, quality and age for up to five higher timeframes, from closed candles only.
Optional extras
Everything here is off by default. Switch it on in the settings when you want it.
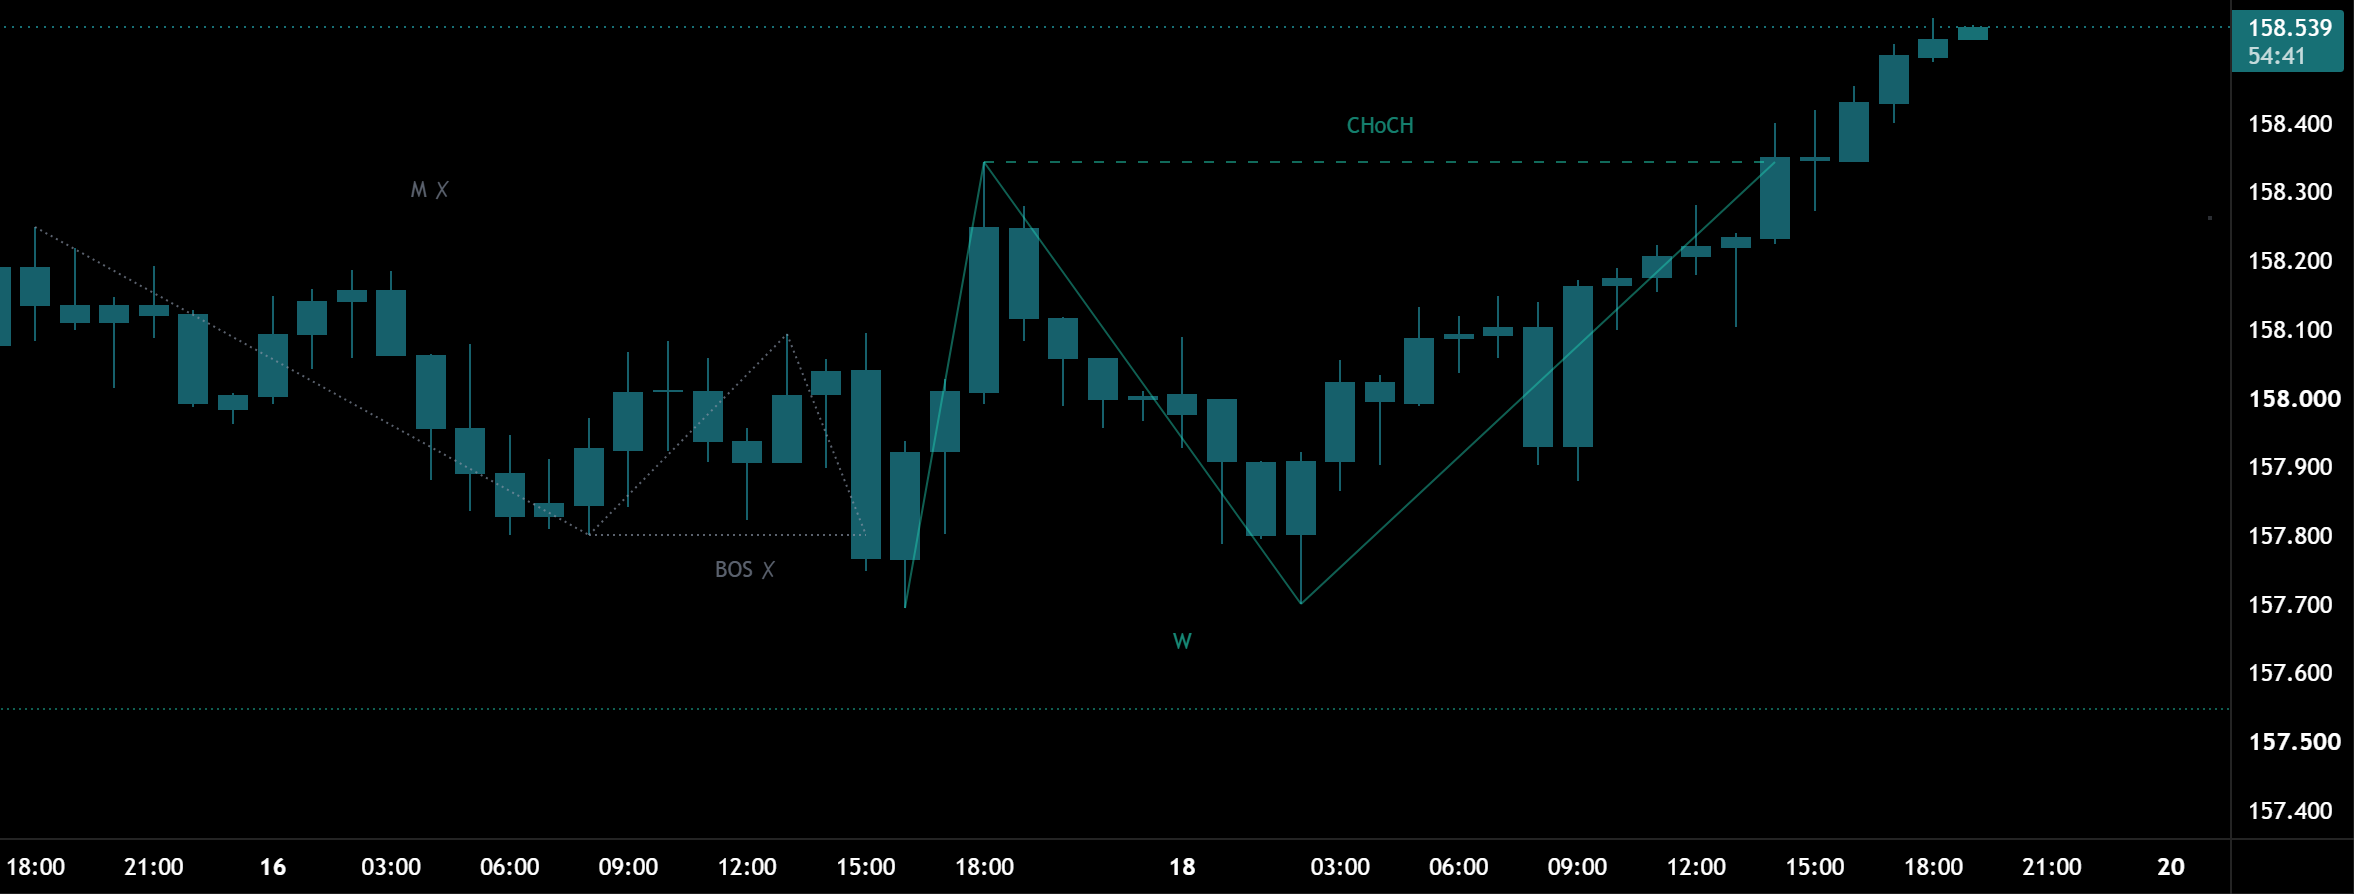
Double tops and bottoms
An M or W appears the moment a structure break goes through its neckline – the low between two highs or the high between two lows – and the two highs or lows are at most 35% of the pattern height apart. If that break fails, the pattern is greyed out with ✗, just like the break. Hover the letter for the details. In the settings: 06 · Liquidity → Double tops / bottoms.
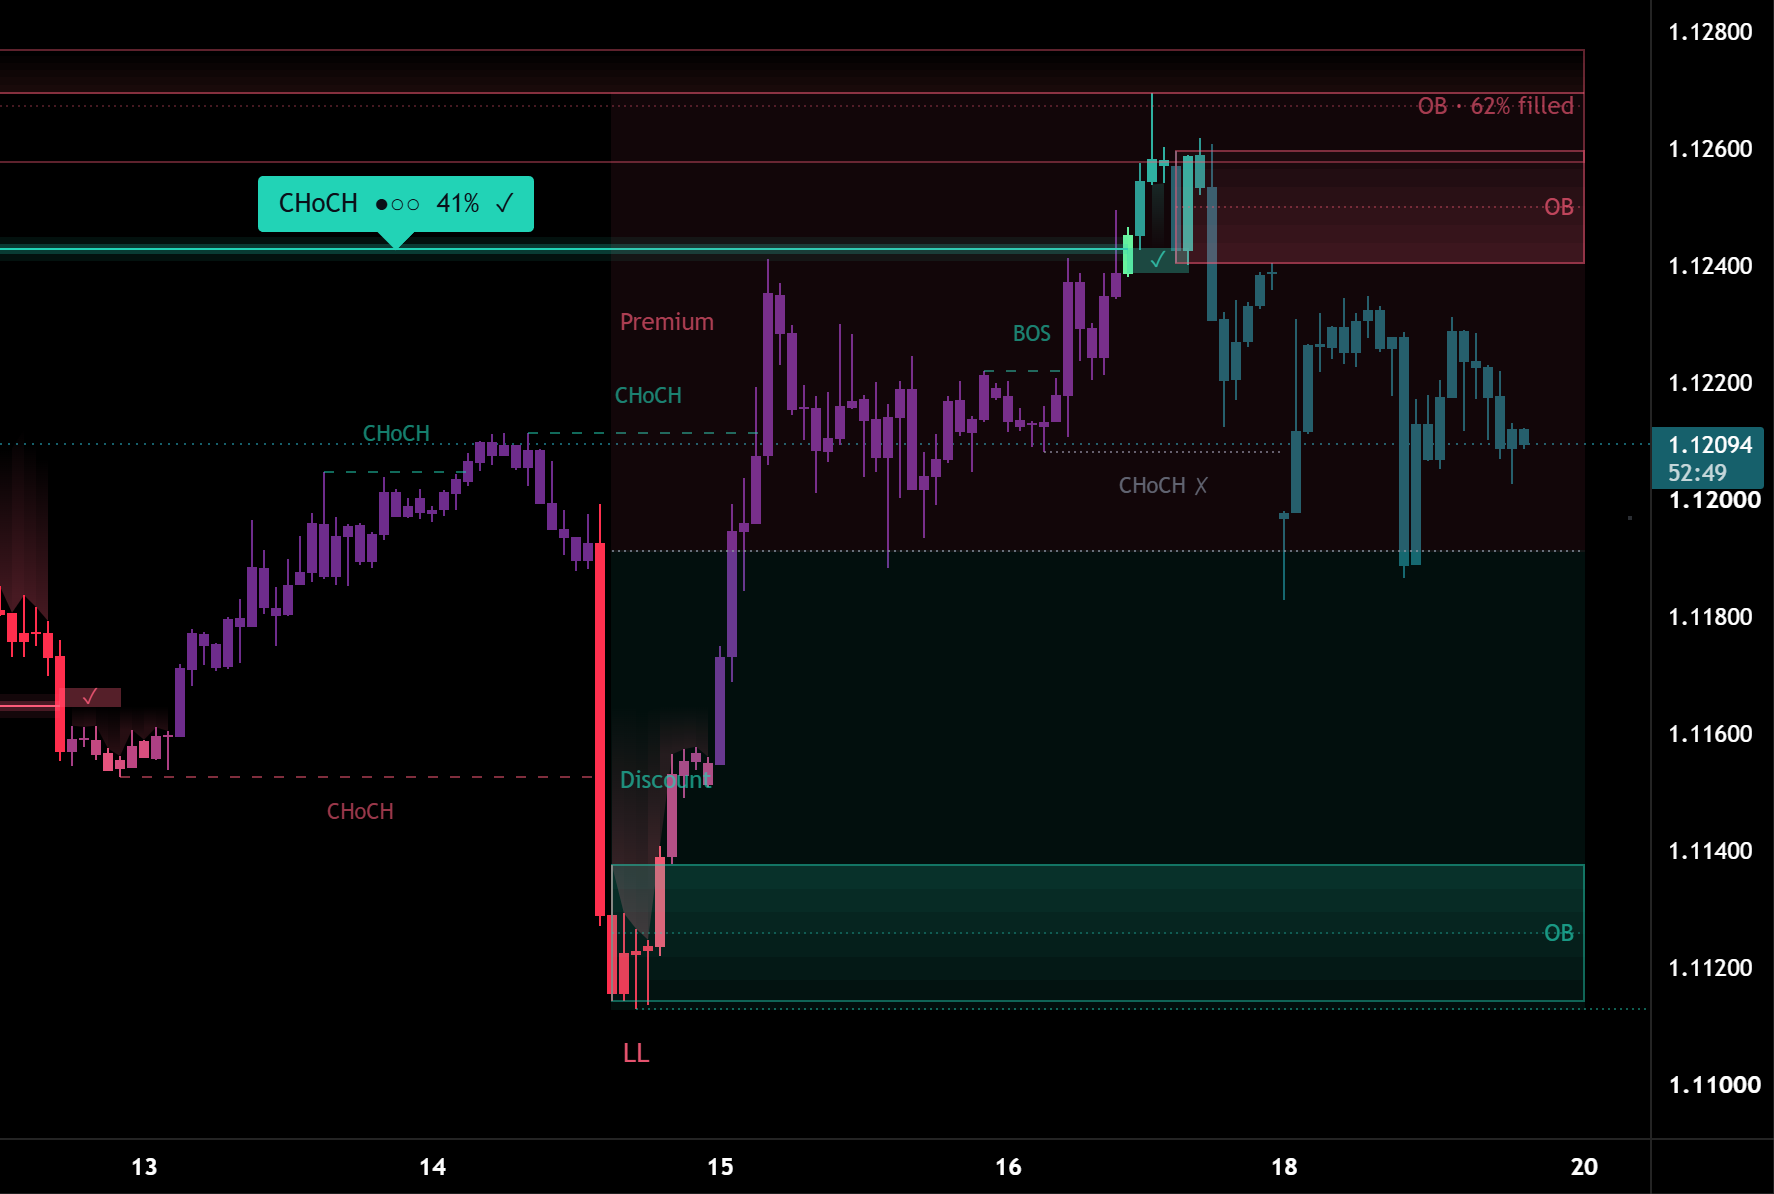
Premium / discount
Shades the current range: premium above its middle, discount below. Under Range you choose the last 100 candles (default) or the 4H structure – the dealing range of the 4-hour chart, which only extends once a new 4H pivot forms beyond a break. The same range drives the order block filter and the premium / discount alert. In the settings: 04 · Order Blocks → Premium / discount and Range.
More extras
- Breaker blocks – order blocks that price closed through, now with the opposite role (04 · Order Blocks)
- Fair value gaps of a higher timeframe, e.g. “4H FVG” (05 · Fair Value Gaps)
- Leg size in % at swing points (01 · Swing Structure)
- Factor analysis: how each quality factor did on your chart (07 · Dashboard)
Chart texts come in small, normal or large, and the colour scheme follows dark and light charts automatically.
Repainting
Breaks and zones are drawn on the closed candle where the information became available – nothing is drawn in hindsight. Later candles only add the outcome (✓ / ✗) and fill levels. Swing points are confirmed after 50 candles (internal: 5) and then labelled on their pivot candle. Higher timeframes use closed candles only.
Alerts
Create one alert with the condition “AE Structure” and “Any alert() function call”, then choose the events in the settings: swing and internal breaks, confirmed breaks, fakeouts, FVG touches, sweeps and closes in premium or discount – break alerts filtered by a minimum quality and with the hold chance in the message. Classic alert conditions for every event and ten values for the Pine Screener are included as well.
Settings guide
The menu has 9 numbered sections. You don’t need to change anything to start – the defaults are the setup the tests ran with, and the calibration values are fixed to exactly those tested settings. Everything beyond the swing structure can be switched off, so the chart can be as full or as quiet as you like.
Quick setups
- Quiet chart: 08 · Display → Candle color Off, Trend cloud off. 01 · Swing Structure → Typical path off.
- Phone: 07 · Dashboard → Layout Compact.
- Premium / discount: 04 · Order Blocks → Premium / discount on, Range as you like.
- Double tops and bottoms: 06 · Liquidity → Double tops / bottoms on.
- Fewer alerts: 09 · Alerts → Minimum quality Strong.
Section by section
Open a section for its main settings. In TradingView, every setting also explains itself behind the ⓘ icon.
01 · Swing Structure
The higher-level highs and lows that define the trend. Swing length (default 50 – larger means higher-level structure), swing points HH / HL / LH / LL with optional leg size in %, active levels, retest zone and the typical path after the latest swing break.
02 · Internal Structure
The smaller highs and lows inside the swing structure, for timing. Internal length (default 5 – smaller means more sensitive) and internal points.
03 · Breaks
When a level counts as broken (candle close or wick), fakeout marks, quality dots and the hold chance on swing labels. A break counts as failed if price closes more than 0.3 ATR back across the level within 5 candles – then it is marked with ✗ and greyed out.
04 · Order Blocks
Which breaks create order blocks (both, swing or internal), how many per side, the discount / premium filter, breaker blocks, premium / discount shading and its range.
05 · Fair Value Gaps
How many gaps per side, gaps from structure breaks only, the 50% line and fair value gaps of a higher timeframe. Gaps start at 0.5 ATR, so only clear gaps stay on the chart.
06 · Liquidity
Equal highs / lows, which sweeps are marked (equal highs / lows or all internal highs / lows) and double tops / bottoms.
07 · Dashboard
Position, text size and layout – Full or Compact – with hold rates and the trend of two higher timeframes, plus the timeframe matrix with its position and the factor analysis table. Higher timeframes are chosen automatically.
08 · Display
Candle color (strength, swing, internal or off), trend cloud, break effects, chart text size, the color scheme (auto, dark or light) and the bullish and bearish colors.
09 · Alerts
Minimum quality and which events alert you: swing and internal breaks, FVG touches, fakeouts, confirmed breaks, sweeps and premium / discount.
Every hold rate is measured with your settings on your chart, so after a change the dashboard shows how the new setup did on that market.
Markets and timeframes
Works on forex, metals, oil, indices, crypto and stocks, on every timeframe. Tested with default settings on 30 market and timeframe combinations from 15 minutes to 4 hours, and checked on the daily chart, in Bar Replay, with the light chart theme and at phone width.
Tips for the best results
- Take direction from the swing structure and timing from the internal structure.
- Watch the self-check next to Quality: where it shows ✓, the hold chances on the labels fit that market – give them weight there.
- Read the order block, fair value gap and sweep rates together with their Random values.
- The more history your chart loads, the richer the statistics: the hold chance in the label appears once 20 breaks have been resolved, the self-check from 30 breaks with a hold chance.
- On a phone, set the dashboard layout to Compact so the chart keeps more room.
Every rate is measured on the chart you are looking at – so you see how breaks really behave on your market, break by break.
Real reviews
What traders say about AE Structure
No reviews yet. Are you using AE Structure? Be the first to share your experience.
Write a review
Only real people: every review is confirmed by email and checked by hand before it appears.
Changelog
What changed in each version.
v10.0
Cleaner settings: nine clear sections instead of 14 (52 instead of 100 settings), calibration values fixed to the tested settings, higher timeframes chosen automatically and options without effect greyed out. Calculations unchanged.
v9.0
Clearer hold chance tooltip: it now also shows how often breaks on your chart with a similar chance have held. Calculations and settings are unchanged.
v8.0
New: a hold chance for every break from your chart's own history – on the swing labels, in the tooltip and in break alerts, with a self-check in the dashboard. Tested on 30 market and timeframe combinations: it predicted the outcome of breaks better than the hold rate of the quality tier on all 30. The tooltips also point out the London session. Bar Replay now also works from the first available day.
v7.0
Dashboard: Layout Full and Layout Compact each use their own table, so Layout Full always shows the full dashboard.
v6.0
New setting "Layout" for the dashboard: Full or Compact. Compact shows three short rows for phones – swing and internal trend with their hold rates, the hold rate of each quality tier with the self-check, and the trend of two higher timeframes. Full stays the default.
v5.0
Tooltip texts updated with the results of a second test on 30 further market and timeframe combinations. Calculations and settings are unchanged.
v4.0
New setting "Range" for premium / discount: last 100 candles (default) or 4H structure – the dealing range of the 4-hour chart, which extends only after a new 4H pivot beyond a break. Shading, order block filter and alert follow the range chosen.
v3.0
Premium / discount: the labels sit at the left edge of the range, clear of zone labels and the dashboard.
v2.0
New: Premium / discount – optional shading of the range of the last 100 candles, the same range the order block filter uses – and an alert when a candle closes in premium or in discount.
v1.0
First release: internal and swing structure with break quality and hold rates, follow-up of every break (✓ / ✗), typical path, order blocks, fair value gaps, EQH / EQL and sweeps with baselines, optional double tops / bottoms, dashboard, timeframe matrix, alerts and Pine Screener values.
Updates
Get notified about updates
One email when AE Market Structure gets a new version – what changed and how to get it. Nothing else.