AE EMA
AE EMA
An EMA that checks itself – it measures whether your market really respects the line and which length counts most.
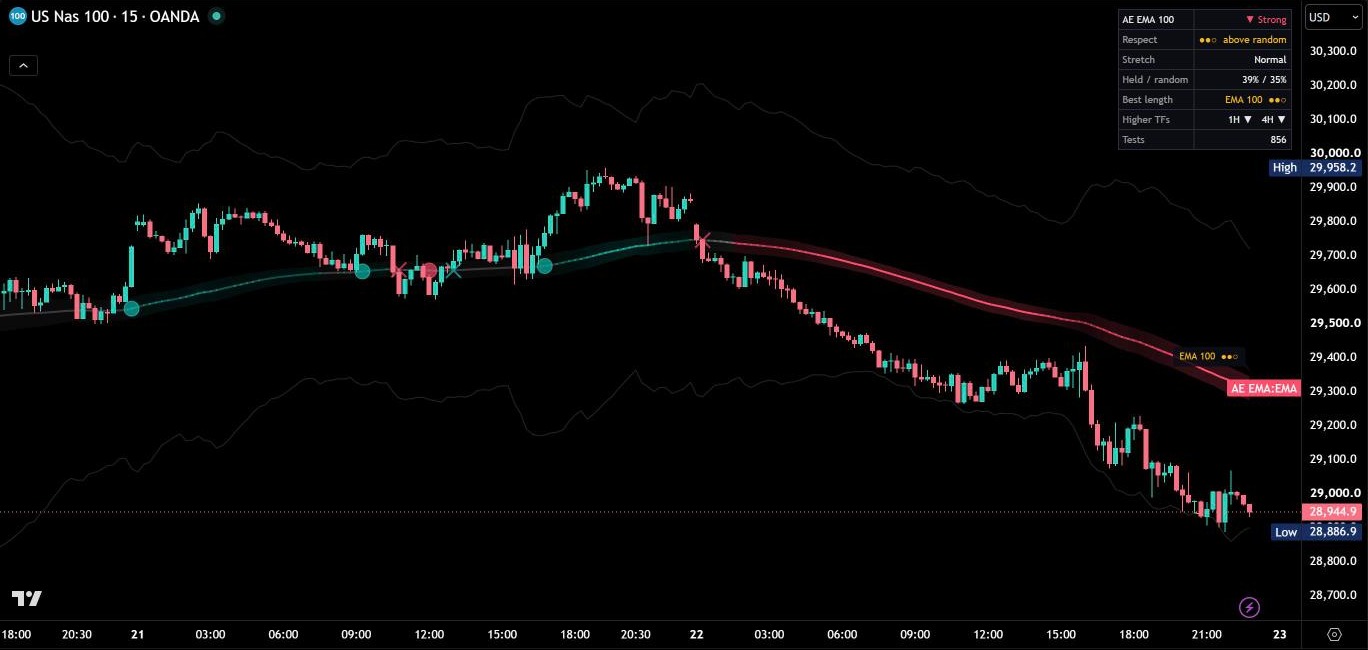
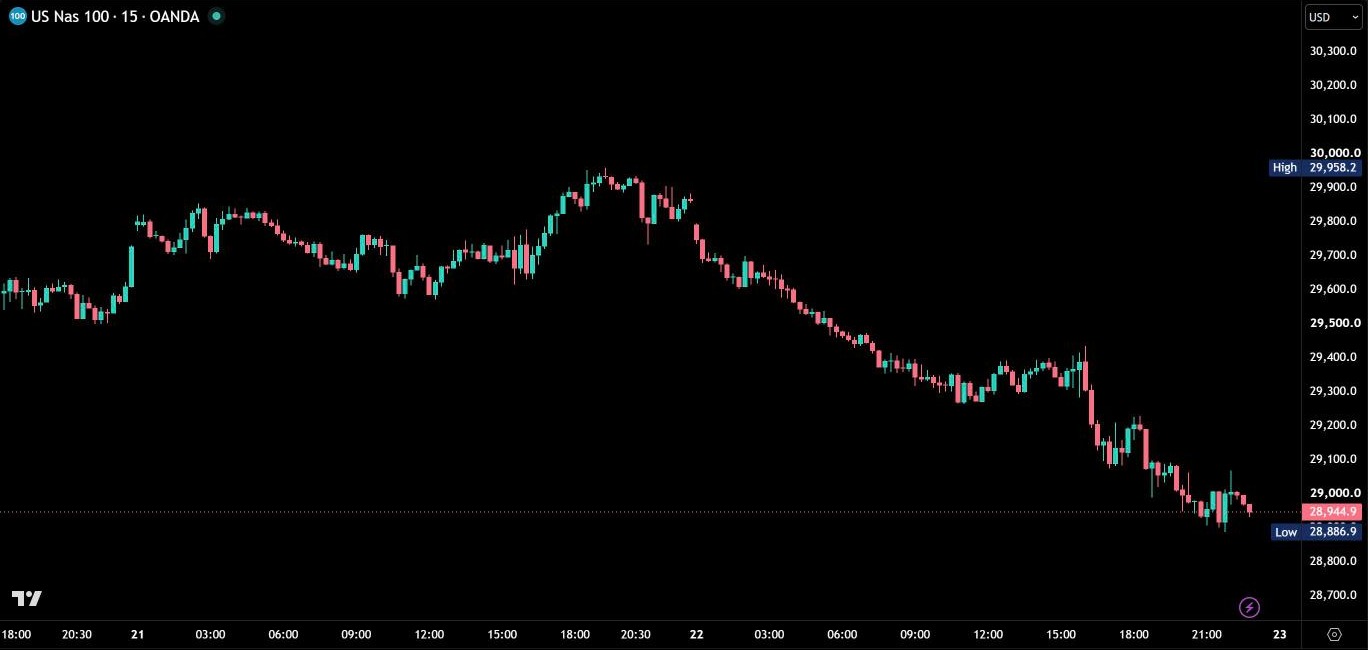
Before / after
Same chart. Now with AE EMA.
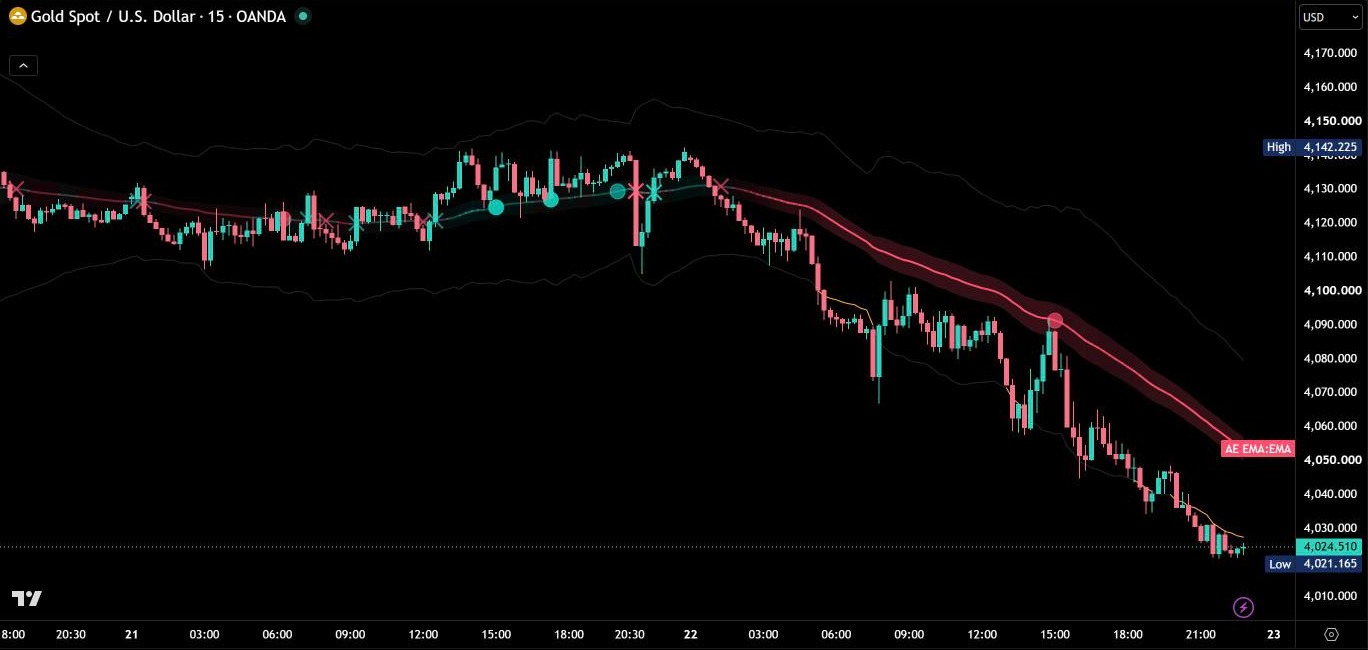
AE EMA is an EMA that checks itself. It measures on your chart how often tests of the line really lead to a reaction – and compares that with a random walk that moves exactly like your market. So you see at a glance whether the EMA carries weight on this symbol and timeframe, and which length your market respects most clearly.
One line, all the information
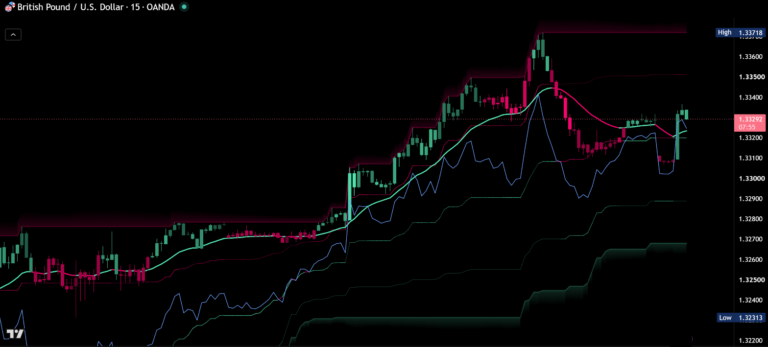
The EMA takes its color from its direction – up, down or flat – and its strength from the ADX: the stronger the trend, the more solid the line. A test band of 0.5 ATR runs around it. A test starts when price closes back into the band from the trend side, and every decided test gets a marker: a circle when the test held and price moved 1 ATR in trend direction first, a cross when price closed through the far side of the band first. Markers are solid when the test started on high volume.

The self-check
For every test, AE EMA calculates how often a random walk built from this market’s own candle moves would have reached the same target from the same point. Comparing the real outcomes with that baseline gives the rating: ●●● clearly above random, ●●○ above random, ●○○ like random. The rating starts after 20 finished tests, and the dashboard shows the share of held tests next to the random share – every rating is backed by numbers.
Which length your market respects
The same check runs in the background for EMA 20, 50, 100 and 200. Best length shows the one your market respects most clearly, and the rating label at the end of the line points to it whenever it beats your current length – one change in the settings and you work with the length that counts.
Stretch limits from your market
The stretch limits mark the distance from the EMA that this market exceeded on only 5% of the last 500 candles. When price reaches them, the lines light up – so overextension is measured on your market instead of guessed.
Everything in one table
Trend direction and strength, respect rating, held versus random, stretch, best length, the EMA direction on the next two higher timeframes and the number of tests. In Compact mode the dashboard shows only trend, respect and stretch, and Mini shows the same rows in small type – made for your phone. In the Auto position the dashboard moves out of the way of the newest candles.
A clean menu
Twelve settings in four groups: EMA length and source, four display switches, dashboard mode and position, and your colors. Everything the measurement needs is fixed to tested values, so you start right away with what matters.
Alerts, no repainting
Alerts for test held, test broken, stretch limit reached and trend direction changed. Test markers appear once a test is decided and never change afterwards, and higher-timeframe values come from closed candles only.
The full market picture
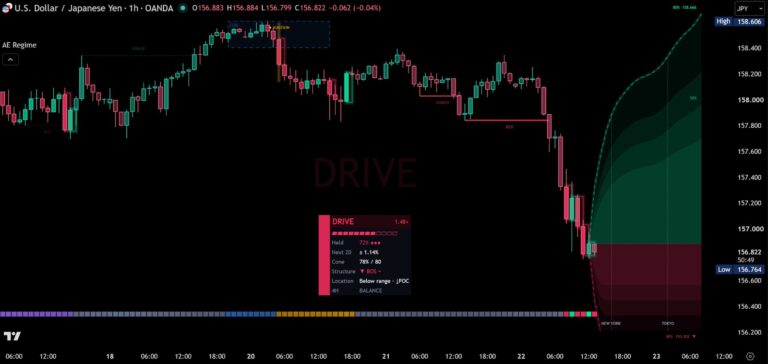
Want to know which phase the market is in and how far the next candles are likely to run? AE Market Regime shows five market phases, an 80% range cone for the next 20 candles and a self-check on your own chart.
How to add AE EMA
- Open AE EMA on TradingView with the button below.
- Click Add to chart and add it to your favorites.
- Start with EMA 50 and look at Best length in the dashboard – it shows which EMA your market respects most clearly.
Real reviews
What traders say about AE EMA
No reviews yet. Are you using AE EMA? Be the first to share your experience.
Write a review
Only real people: every review is confirmed by email and checked by hand before it appears.
Changelog
What changed in each version.
v1.1
New Mini dashboard for phones and a new Auto position that keeps the dashboard clear of the newest candles.
v1.0
First release.
Updates
Get notified about updates
One email when AE EMA gets a new version – what changed and how to get it. Nothing else.