Liquidity sweeps: why price takes the highs before it turns
Equal highs, session highs and the previous day’s levels attract orders. How to tell a sweep from a real break – once the candle has closed.
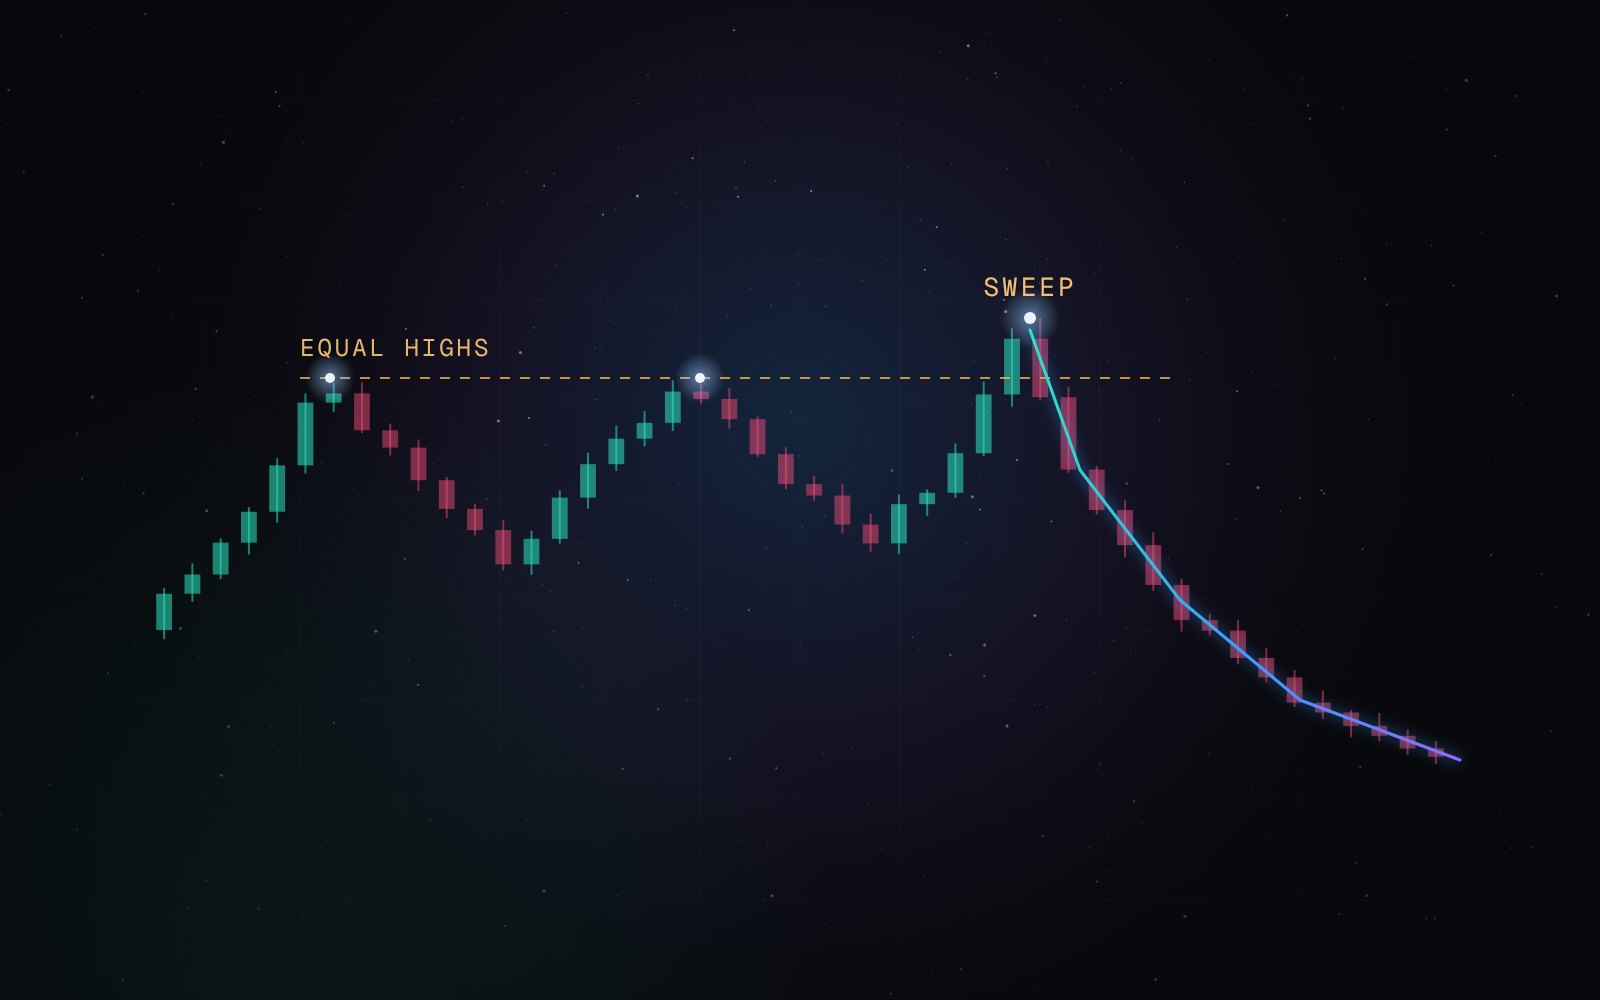
Above highs and below lows sit stop orders and breakout orders – liquidity. Price is regularly drawn to these levels. Knowing where they are and how price reacts there is one of the most useful skills in intraday trading.
Where liquidity sits
- Equal highs and equal lows (double tops and bottoms)
- The previous day high and low
- Session highs and lows, for example the Asia range before London opens
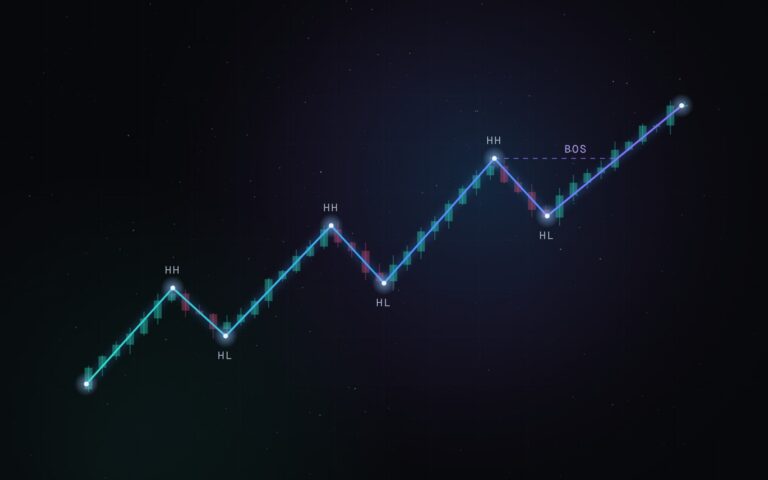
- Obvious swing highs and lows
- Round numbers
Sweep or break?
A sweep takes a level and the candle closes back inside. A break closes beyond the level and holds there. The difference is only known at the close of the candle – that is why experienced traders wait for it instead of reacting to the wick.
A classic session pattern
Asia often builds a range. London or New York then runs one side of that range – for example the Asia high – before the market moves the other way. It is a pattern worth knowing, and you can check on your own market how often it happens.
Trading a sweep
- Wait for the candle to close back inside the level.
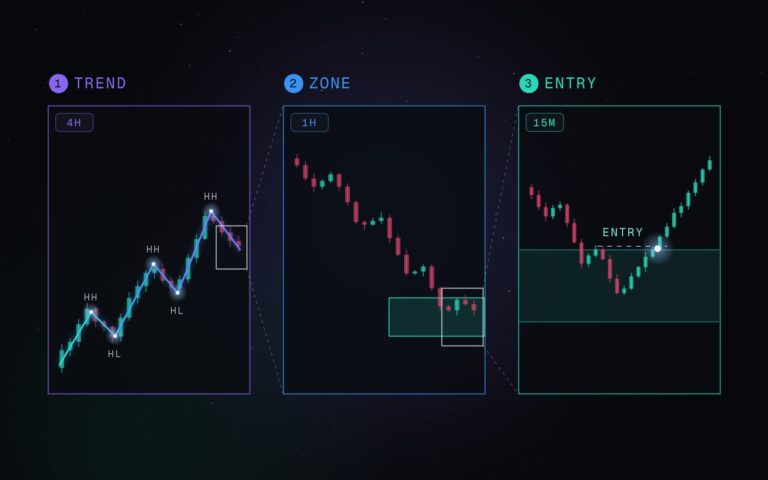
- Look for a change of character on a lower timeframe.
- Place the stop beyond the sweep wick.
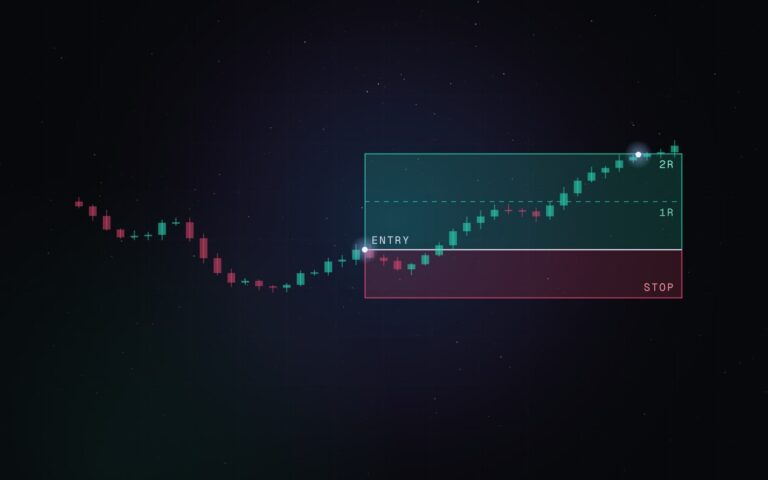
- Aim for the other side of the range or the next liquidity.
How AE Sessions helps
AE Sessions draws the session highs and lows and the previous day levels on your chart and marks every taken level as Sweep or Break as soon as the candle has closed. Its dashboard shows how often New York takes the Asia high or low on the market you are looking at.
Educational content. It is not investment advice and not a recommendation to buy or sell. Risk disclosure