How to read market structure: swings, breaks and changes of character
Higher highs, lower lows, BOS and CHoCH explained in plain words – and the mistakes that make structure look clearer than it is.
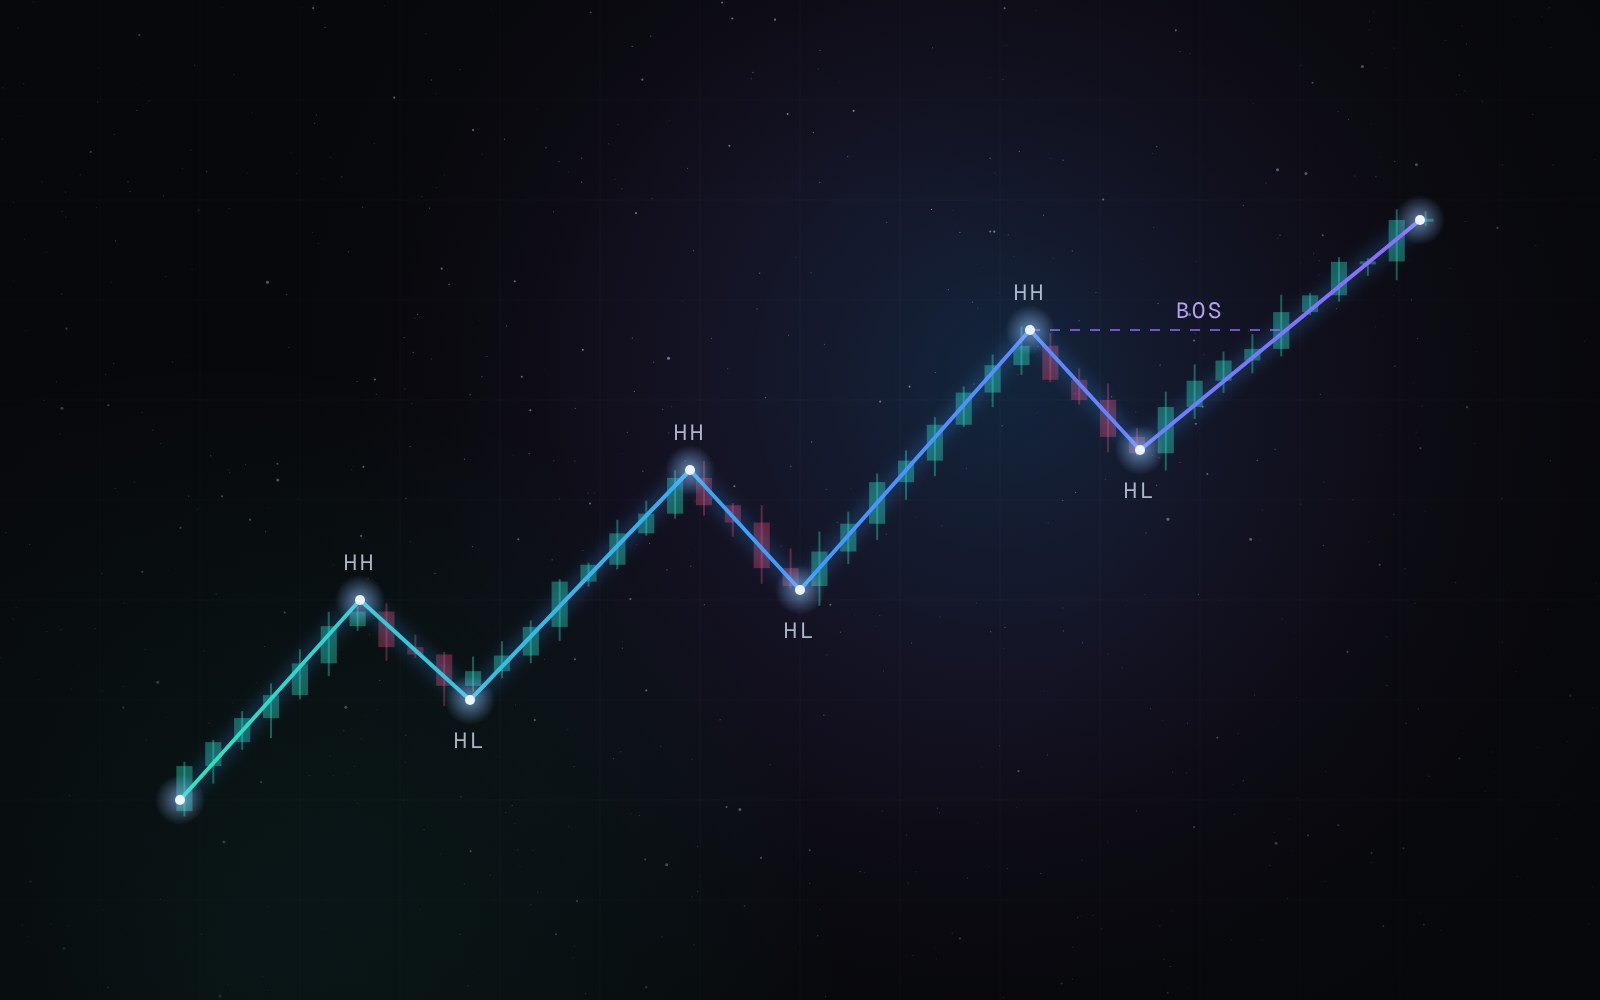
Market structure is the order in which price makes its highs and lows. It is one of the oldest ways to read a chart, and it answers a simple question: is the market currently stepping up, stepping down, or going nowhere?
Swing highs and swing lows
A swing high is a bar whose high is higher than the highs of the bars around it. A swing low is the opposite. How many bars on each side you require decides how big the swings are: few bars give many small swings, more bars give fewer, more important ones.
One detail matters a lot: a swing is only confirmed after the bars on its right side have closed. On a live chart you never know in the moment that this is the high – you know it a few bars later. Tools that mark the swing immediately and move it afterwards are repainting.
Trend in structure terms
- Uptrend: higher highs (HH) and higher lows (HL).
- Downtrend: lower highs (LH) and lower lows (LL).
- Range: neither – highs and lows overlap without a clear direction.
Break of structure (BOS)
In an uptrend, a break of structure happens when price closes above the last swing high. It confirms that the trend has continued. In a downtrend it is a close below the last swing low. A BOS says nothing about how far the move will go – only that the existing order is intact.
Change of character (CHoCH)
A change of character is the first break against the trend: in an uptrend, a close below the last higher low. It is the first sign that the order may be changing. It is not a guarantee of a reversal – often it is only a deeper pullback or the start of a range.
Common mistakes
- Counting wicks as breaks. A wick through a level is not the same as a close beyond it.
- Mixing timeframes. A CHoCH on 5 minutes can be a normal pullback on the 4-hour chart.
- Treating every CHoCH as a signal to trade the other way.
- Changing the swing size until the chart shows what you hope to see.
How to use it
Start on a higher timeframe to see the bigger order, then look at a lower one for detail. Wait for closes instead of reacting to wicks, and keep the swing settings fixed. Structure gives you the context – combine it with your own rules for entries, exits and risk.
Educational content. It is not investment advice and not a recommendation to buy or sell. Risk disclosure