Glossary
Market structure
In short
Market structure is the sequence of swing highs and swing lows that shows whether price is trending up, trending down or moving sideways.
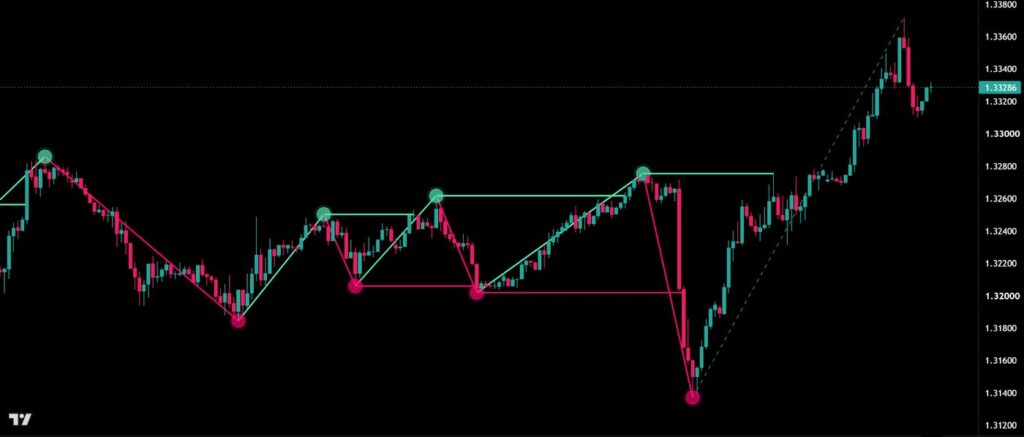
Uptrend, downtrend, range
In an uptrend, price makes higher highs (HH) and higher lows (HL). In a downtrend, it makes lower highs (LH) and lower lows (LL). When neither pattern holds, the market is moving sideways in a range.
Why traders watch it
Structure gives every other tool its context. Many traders only look for long trades while the structure is bullish and only for short trades while it is bearish. A break of structure confirms the trend, a change of character is the first sign that it may turn.
Structure on several timeframes
The daily chart can be bearish while the 15-minute chart is bullish. That is why it helps to read the structure from the higher timeframe down: the big picture sets the direction, the lower timeframe the timing.