Multi-timeframe analysis: from the big picture to the entry
A simple top-down routine with three timeframes – direction, zone and entry – and which timeframe combinations fit together.
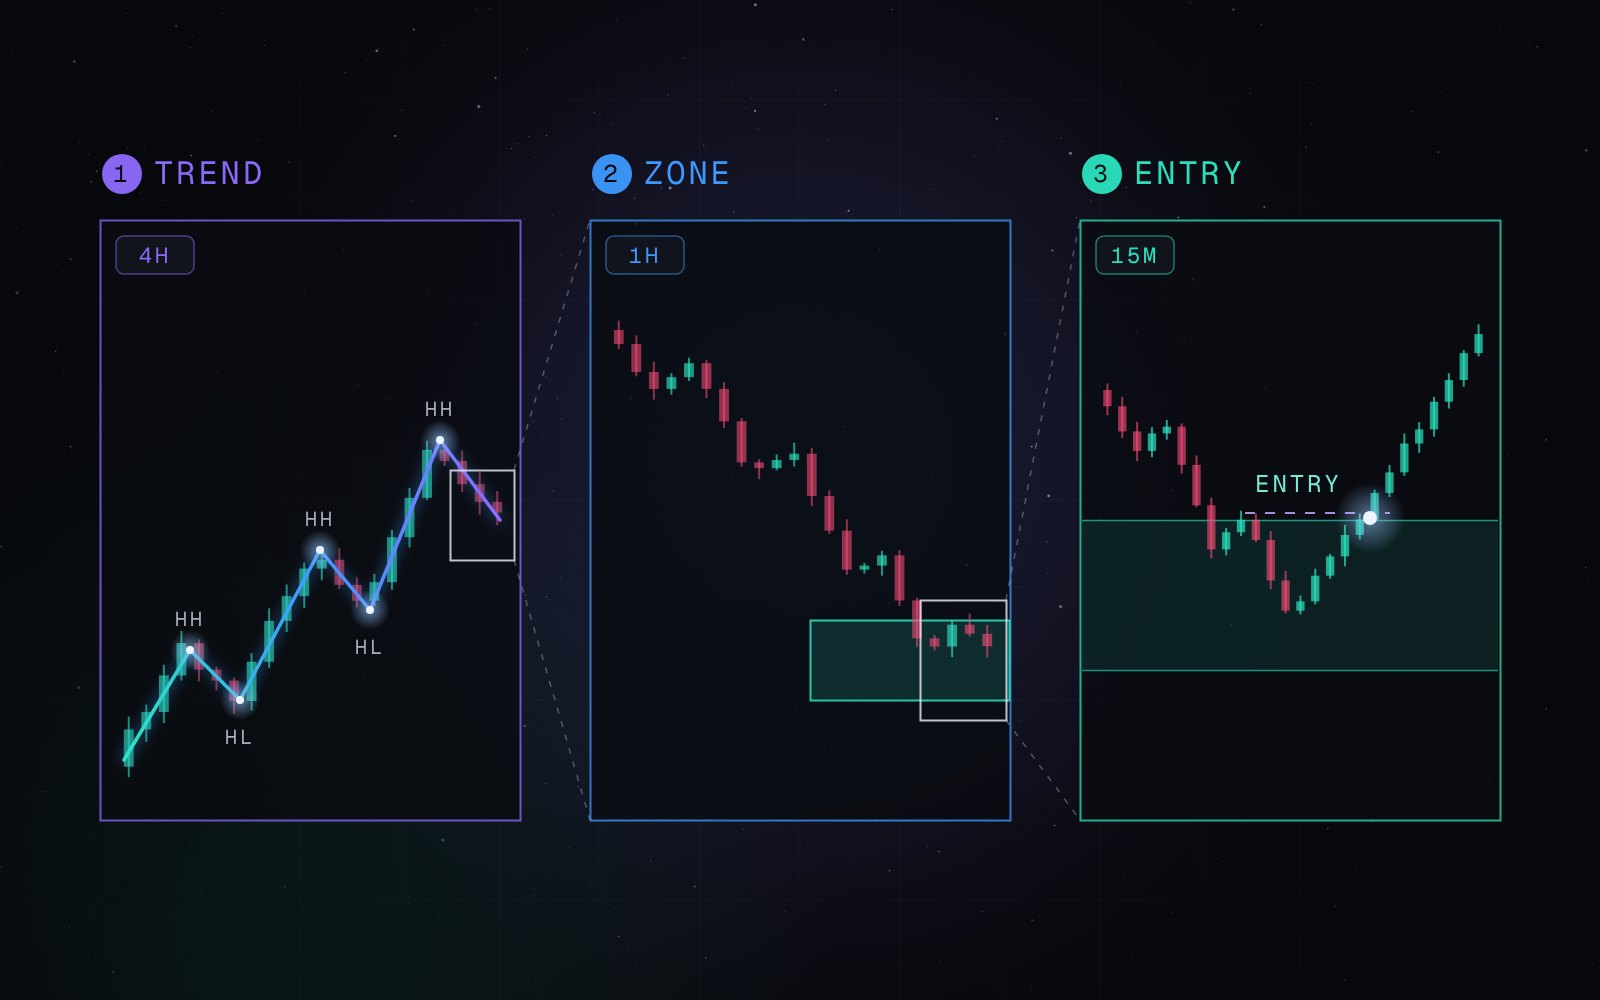
One chart rarely tells the whole story. Looking at the same market on several timeframes shows you the direction, the areas that matter and the right moment to act – in that order.
Three timeframes, three jobs
- Higher timeframe: the direction – market structure and trend.
- Middle timeframe: the areas – zones, order blocks and fair value gaps.
- Lower timeframe: the entry – a change of character or a sweep at your area.
Combinations that fit
- Swing trading: weekly – daily – 4 hours
- Day trading: 4 hours – 1 hour – 15 minutes
- Intraday: 1 hour – 15 minutes – 1 to 5 minutes
A factor of about four to six between the timeframes works well: each lower chart then shows clear detail of a single move on the higher one.
Top-down in five steps
- Mark the market structure on the higher timeframe.
- Mark the zones in that direction on the middle timeframe.
- Wait until price reaches one of those zones.
- Switch to the lower timeframe and wait for your entry trigger.
- Plan stop and target, then size the position from the stop.
Keep it focused
- Three timeframes are enough – more charts mean more noise.
- Decide on your timeframes before the session and stick to them.
- Trade in the direction of the higher timeframe unless you have a clear reason not to.
Putting it together
With a fixed routine you look at every chart the same way – and you see faster when a setup is complete. That calm, repeatable process is what turns analysis into consistent decisions.
Educational content. It is not investment advice and not a recommendation to buy or sell. Risk disclosure